Traders work on different strategies in the market. One of those strategies is (Stock Trading Near Day High). Stocks that close above their previous day’s high by breaking the previous high, they close by making a new high. And stocks that trade around the previous day’s high.
Reversal patterns are formed in the daytime frame after such a stock market closes. Big moves are seen in stocks after breakouts and breakdowns of reversal patterns.
How to Find these types of stocks using chartink screener? In this post, some methods have been shared to find Stocks Trading Near Day High.
What Is Stock Trading Near Day High?
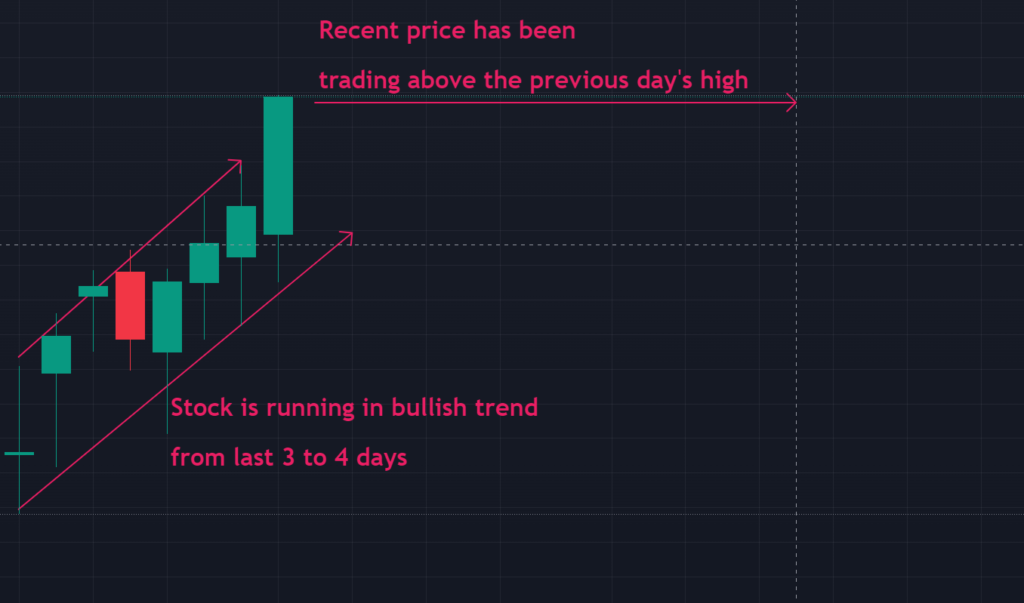
Stock Trading Near Day Highs are such stocks whose recent price is around the previous day’s high till the market closes. Such stocks are continuously running in a bullish trend in the one-day time frame.
Stock Trading Near 2 Days High Screener Chartink
- Latest ( Candle High ) Greater than Previous ( 1 Day Candle High )

Stock Trading Near 2 Days High Screener Chartink
- Latest ( Candle High ) Greater than Previous ( 1 Day Candle High )
- Latest ( 1 Day Candle High ) Greater than Previous ( 2 Day Candle High

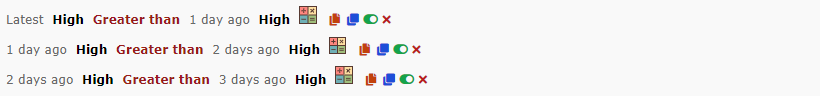
Stock Trading Near 3 Days High Screener Chartink
- Latest ( Candle High ) Greater than Previous ( 1 Day Candle High )
- Latest ( 1 Day Candle High ) Greater than Previous ( 2 Day Candle High )
- Latest ( 2 Day Candle High ) Greater than Previous ( 3 Day Candle High )
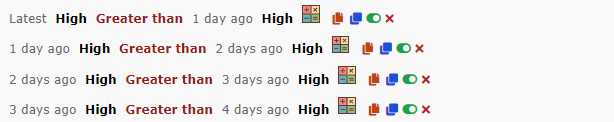
Stock Trading Near 4 Days High Screener Chartink
- Latest ( Candle High ) Greater than Previous ( 1 Day Candle High )
- Latest ( 1 Day Candle High ) Greater than Previous ( 2 Day Candle High )
- Latest ( 2 Day Candle High ) Greater than Previous ( 3 Day Candle High )
- Latest ( 3 Day Candle High ) Greater than Previous ( 4 Day Candle High )
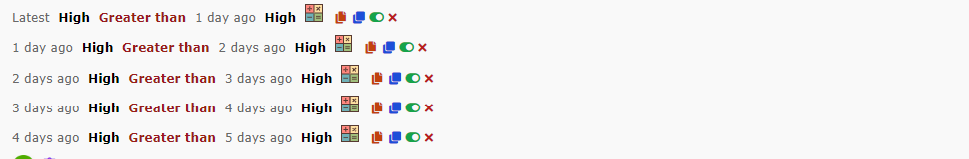
Stock Trading Near 5 Days High Screener Chartink
- Latest ( Candle High ) Greater than Previous ( 1 Day Candle High )
- Latest ( 1 Day Candle High ) Greater than Previous ( 2 Day Candle High )
- Latest ( 2 Day Candle High ) Greater than Previous ( 3 Day Candle High )
- Latest ( 3 Day Candle High ) Greater than Previous ( 4 Day Candle High )
- Latest ( 4 Day Candle High ) Greater than Previous ( 5 Day Candle High )
Five formulas of Stock Trading Near Day High have been shared through this post. Using Chartink, you can easily find this type of stocks. The stock price is trading around the same for the last 1, 2, 3, 4, and 5 days.