Every day traders trade in the stock market using different types of indicators on different charts. They seek the help of indicators to identify trend in different stocks and market indices on different time frames.
There are thousands of indicators in the market which traders use daily. One of these thousands of indicators is the EMA (Exponential Moving Average), which is a dynamic indicator and used by almost every trader. They use this indicators in different ways with different strategies.
One of those strategies is EMA Crossover to find out the bearish and bullish trade in the stock. When there is a crossover between two EMAs, then you can make a trade by using it as a strategy.
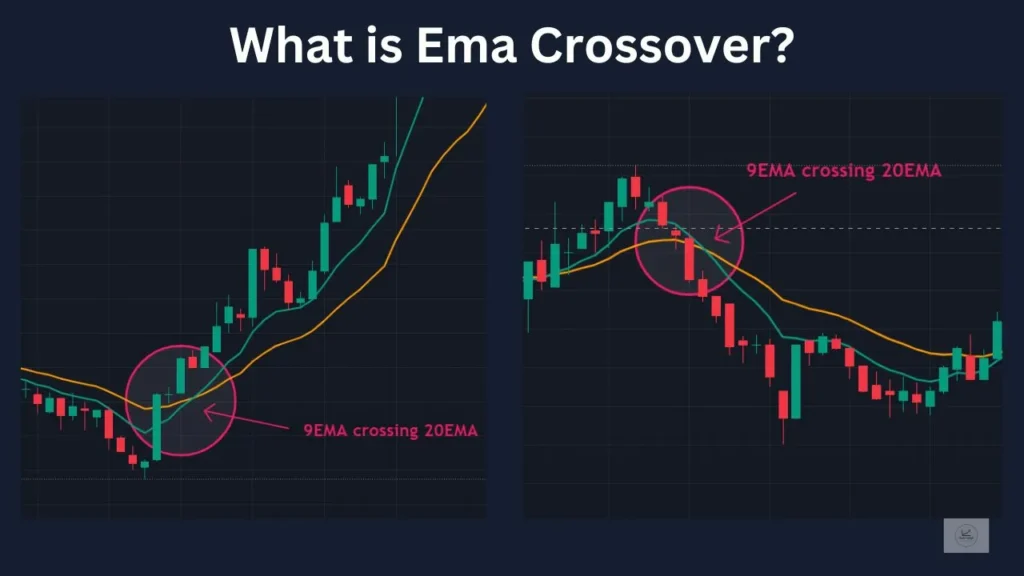
What is EMA Crossover?
Whenever a shorter-time EMA crosses a longer-time EMA, it is called an EMA crossover in stock market parlance. For example, 9EMA crossing 20EMA, 20EMA crossing 50EMA and 20EMA crossing 50EMA.
- In an EMA crossover, when the short-term EMA crosses the long-term EMA from below, there is a possibility of a bull run in the stock.
- Conversely, when the short-term EMA crosses the long-term EMA from top to bottom, there is a possibility of a bear run in the stock.
Creating EMA Crossover Scanner in Chartink
There are thousands of stocks in the stock market, in which there is a crossover between one Ema and the other Ema. But in which stock, when has the crossover of Ema, and at what time?
You can make a scanner about them on Chartink for free. You will have to write some formulas to make a screener of Ema Crossover on Chartink.
9 EMA to 20 EMA Crossover Scanner Chartink
9 EMA to 20 EMA crossover is used for intraday trading. When these two EMAs cross each other. After this, you can achieve small targets by creating a position. These two are mostly used in 5 min time frame and above 15 min time frame.
EMA Bullish Crossover-:

EMA Bearish Crossover-:

20 EMA to 50 EMA Crossover Scanner Chartink
20 EMA to 50 EMA Crossover is seen only in 1 week in any stock and index 1, 2. That’s why these EMA’s are used for swing trading. In swing trading, the futures of stock are held for 2 to 4 days. The accuracy of 20 EMA to 50 EMA Crossover is good for swing trading in a 1-hour time frame.
EMA Bullish Crossover-:

EMA Bearish Crossover-:

50 EMA to 100 EMA crossover Scanner Chartink
After 50 EMA to 100 EMA crossover is done invest in the stock for 2 to 3 months. When there is a 50 EMA to 100 EMA crossover from the smaller time frame to the larger time frame, it is called a Gloden crossover.
EMA Bullish Crossover-:

EMA Bearish Crossover-:

100 EMA to 200 EMA crossover Scanner Chartink
The 100 EMA to 200 EMA crossover consists of data from the previous 100 and 200 candles. The data is enough to define the trend of any stock. When the candle of the stock trades above 200 and 100 EMA.
There are always more bullish trades in that trend. When the candle of the stock is below both these ema, then the stock is considered in a downtrend.
EMA Bullish Crossover-:

EMA Bearish Crossover-:

Note- The formulas shared in this post are all set on 1 daytime frame. When you use these formulas, you can create a strategy on different Ema Crossover by changing the time frame according to your convenience.
Also Read: Bearish Inside Candle Scanner on Chartink