It is important for traders to analyse the charts on different time frames for better identification of trend and structures. Similarly, traders plan their trades in different time frames. The Bearish Inside Candle Pattern is same in every time frame. But the time frame of the chart is different like 5 minutes, 15 minutes, 30 minutes, 1 hour, and 1 day.
Similarly, these time frames are used for different types of trading, such as swing trade, intraday trade, and long-term investment. Now, suppose you have a little knowledge of Chartink. So how can you create scanners for the Bearish Inside Candle pattern on Chartink for different time frames?
What is Bearish Inside Candle?
The Bearish Inside Candle pattern consists of two candles, one is a bullish candle and the other is a bearish candle. Whenever we see this pattern and the next candle breaks the the previous Bearish Inside Candle’s low then we consider that the trend is revered and downtrends would begin from here.
Rules of Bearish Inside Candle
Without Rules you wouldn’t be able to find accurate Bearish Inside Candle. Some rules for perfect identification of the Bearish Inside Candle pattern are:
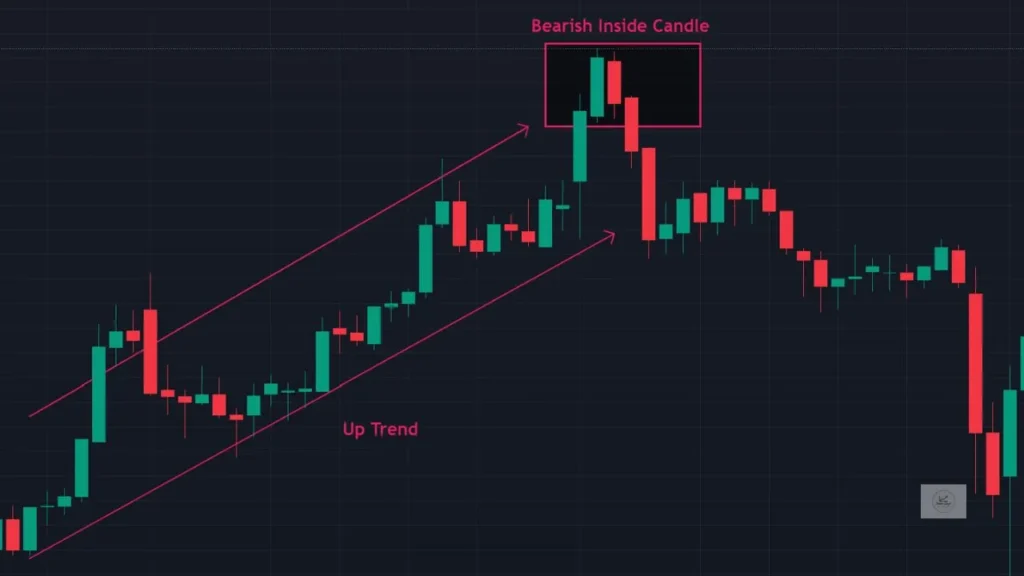
- The first candle has to be bullish and the next one should be a bearish candle.
- The high of the bearish candle must be lower than the high of the bullish candle
- The low of the Bearish candle must be lower than the low of the Bullish candle.
- The body of both candles should be bigger than the wick.
- The high of both candles must be greater than the high of the previous 20 candles.
- The stock should be in an up trend.
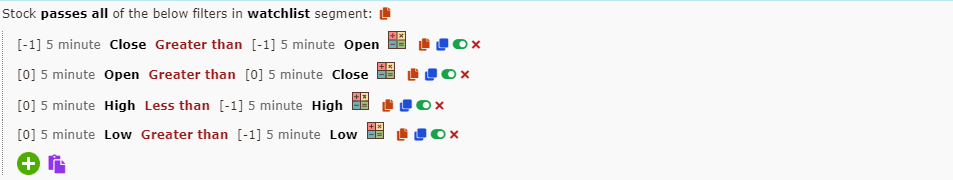
5 Min Bearish Inside Candle Condition Chartink Screener
- Previous ( 5 min Candle Close ) Greater than Previous ( 5 min Candle Open )
- Latest ( 5 min Candle open ) Greater than Latest ( 5 min Candle close )
- Latest ( 5 min Candle High ) less than previous ( 5 min Candle High )
- Latest (5 min Candle low ) less than previous (5 min Candle low )
15 Min Bearish Inside Candle Condition Chartink Screener
- Previous ( 15 min Candle Close ) Greater than Previous ( 15 min Candle Open )
- Latest ( 15 min Candle open ) Greater than Latest ( 15 min Candle close )
- Latest ( 15 min Candle High ) less than previous ( 15 min Candle High )
- Latest (15 min Candle low ) less than previous (15 min Candle low )

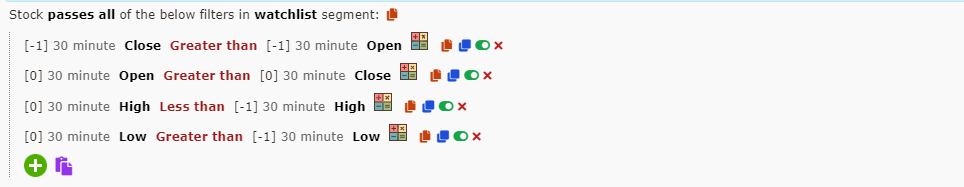
30 Min Bearish Inside Candle Condition Chartink Screener
- Previous ( 30 min Candle Close ) Greater than Previous ( 30 min Candle Open )
- Latest ( 30 min Candle open ) Greater than Latest ( 30 min Candle close )
- Latest ( 30 min Candle High ) less than previous ( 30 min Candle High )
- Latest (30 min Candle low ) less than previous (30 min Candle low )
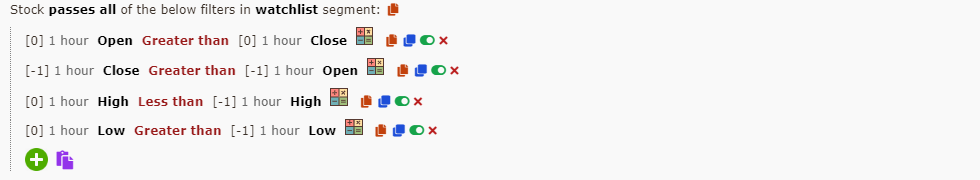
1 Houre Bearish Inside Candle Condition Chartink Screener
- Previous ( 1 Houre Candle Close ) Greater than Previous (1 Houre Candle Open )
- Latest ( 1 Houre Candle open ) Greater than Latest (1 Houre Candle close )
- Latest ( 1 HoureCandle High ) less than previous ( 1 Houre Candle High )
- Latest (1 Houre Candle low ) less than previous (1 Houre Candle low )
1 Day Bearish Inside Candle Condition Chartink Screener
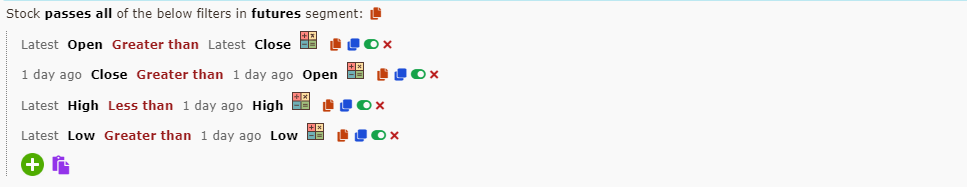
- Previous ( 1 Day Candle Close ) Greater than Previous (1 Day Candle Open )
- Latest (1 Day Candle open ) Greater than Latest (1 Day Candle close )
- Latest (1 Day Candle High ) less than previous (1 Day Candle High )
- Latest (1 Day Candle low ) less than previous (1 Day Candle low )
Conclusion
Using the conditions given above you can easily create your own screeners on Chartink to filter out stocks forming Bearish Inside Candles for Different time frames.
Also Read: How to Create Scanner for All Time High Stocks List On Chartink