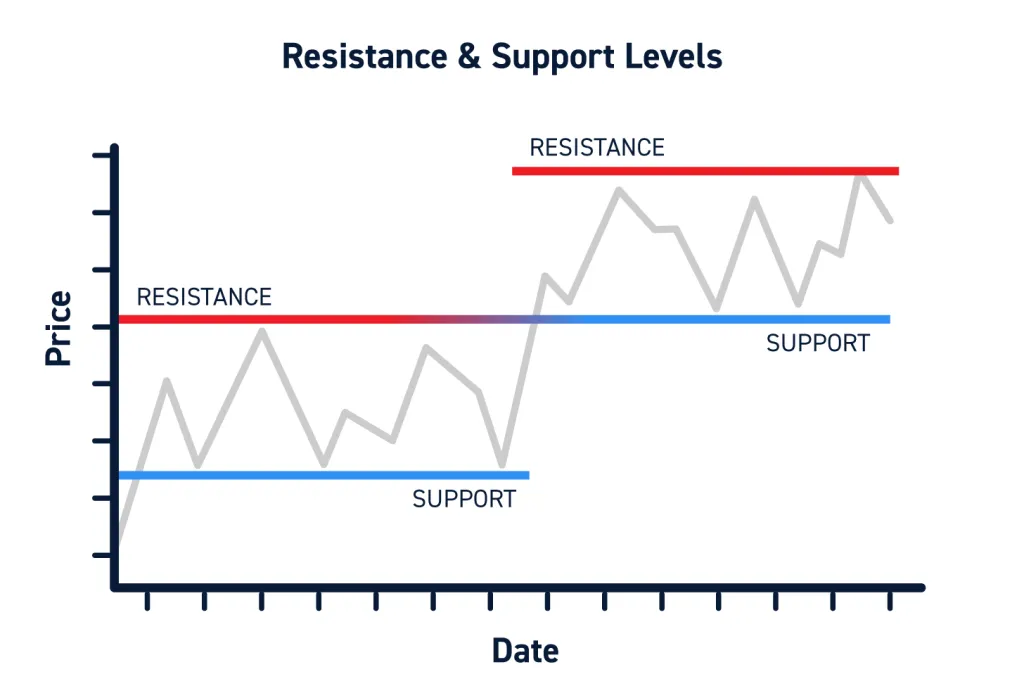
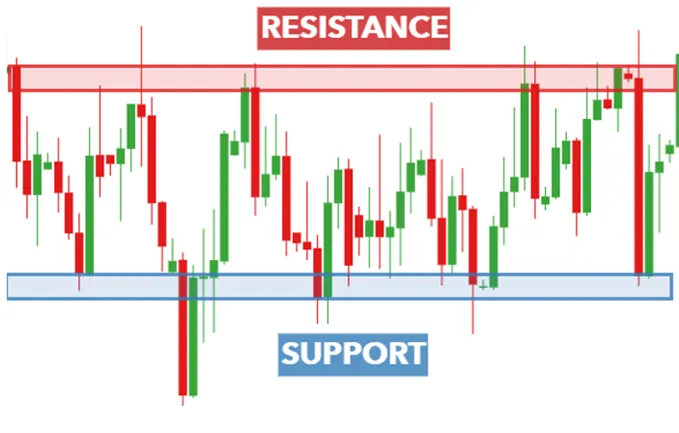
Support and resistance levels are key concepts in technical analysis used by traders and investors to make informed decisions in financial markets. These levels are based on the idea that prices tend to exhibit recurring patterns and that historical price levels can act as barriers or zones where buying or selling activity is likely to occur.

- Support Level:
- Definition: Support is a price level at which a financial asset tends to stop falling and may even bounce back upwards. It’s like a safety net for the price.
- Explanation: When the price of an asset approaches a support level, there is often an increase in buying interest because traders expect the price to go up from that point. This increased demand can prevent the price from falling further.
- Resistance Level:
- Definition: Resistance is a price level at which a financial asset tends to stop rising and may reverse direction. It acts as a barrier preventing the price from moving higher.
- Explanation: When the price of an asset reaches a resistance level, there tends to be increased selling interest. Traders believe the price is too high at this point, and this increased supply can cap further upward movement.
Key Points:
- Role Reversal: Once a support level is breached, it may turn into a resistance level, and vice versa. This is known as role reversal and happens because the psychology of market participants changes when price dynamics shift.
- Not Exact Numbers: Support and resistance levels are often seen as zones rather than exact prices. Prices may not precisely touch the identified levels but can hover around them.
- Volume Confirmation: Traders often look for confirmation from trading volume. A price movement accompanied by high trading volume is seen as more significant than a movement on low volume.
- Time Frames: Support and resistance levels can be identified on different time frames (daily, weekly, monthly). A level that is significant on a daily chart might not be as relevant on a weekly or monthly chart.
- Use of Indicators: Traders often use technical indicators (like moving averages, trendlines, or Fibonacci retracement levels) in conjunction with support and resistance to make more informed decisions.
Understanding support and resistance levels can help traders make decisions about entry and exit points, set stop-loss orders, and identify potential trend reversals. It’s important to note that while these concepts can be helpful, no method is foolproof, and risk management is crucial in trading.


